Content
Demonstrations of Paige content.
Will Faught
Shortcodes
Demonstrations of Paige shortcodes.
Will Faught
Customization
Demonstrations of Paige customization.
This site hides some section page data by default. This page shows it all.
customization
paige
sections
Demo Series
Will Faught
1 minute
English Channel Geostrophic Wind Metrics
The following plots show the sea-level pressure recorded in London, Paris and De Bilt over the last year and the geostrophic wind that has been derived from these three sites.
The plots are initially zoomed into the last 31 days but using the slider below the plots the timespan can be expanded up to the a year.
These values are calculated from the SLP readings taken at 1200 UTC.
Will Faught
1 minute
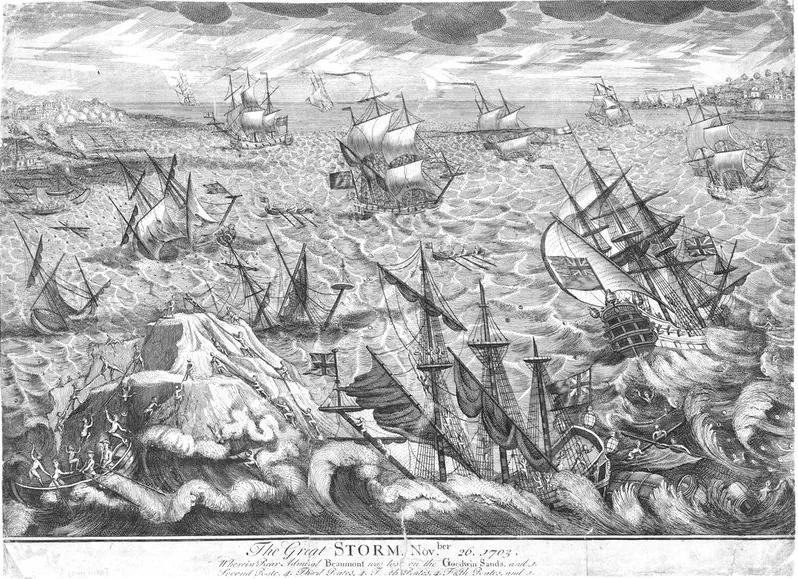
Gales
UK Gales Index TEST The data used in this plot is taken from https://crudata.uea.ac.uk/cru/data/lwt/ and shows the number of storms across the UK at three different levels of severity during the extended winter season (October to April).
Will Faught
1 minute
Layouts
Demonstrations of Paige layouts.
Will Faught
Westerly Index
Paris-London Westerly Index The following plots shown the monthly mean SLP values at London and Paris and the normalized difference in SLP at the two sites, which provides a measure of zonal wind flow.
Will Faught
1 minute